Program Mission and Goals
Program Mission
The mission of the Physician Assistant Program at the University of Oklahoma, School of Community Medicine, Tulsa, is to train physician assistants to provide quality health care to the citizens of Oklahoma with an emphasis on serving diverse and underserved communities.
The OU SCM Physician Assistant Program in Tulsa, Oklahoma was founded in 2008 to meet the needs of the state of Oklahoma for health care providers.
Since the first class graduated in 2010, the program has produced 376 PAs, 97% of the students who entered the program. Of the graduates from 2010-2025 that have taken the Physician Assistant National Certifying Examination (PANCE), 98% have passed on their first attempt. Every graduate seeking employment is currently practicing clinically, with 80% in the state of Oklahoma. These outcomes illustrate that we are successful in providing quality PAs to the citizens of Oklahoma.
Our most impressive success is the fact that 49% of our graduates from the 2022-2024 cohorts are providing health care services to underserved communities, reflecting the deeply rooted mission of our program.
Program Goals and Success in Meeting Goals
The goals of the OU School of Community Medicine PA program are:
1. Provide graduates with the medical knowledge, clinical reasoning and skills necessary for entry-level practice as a PA.
Rationale: The OU SCM PA Program has a responsibility to provide an exceptional education to our students to equip them to be highly competent clinical providers. Students are assessed in the last four months of the program with the PAEA End of Curriculum (EOC) exam and complete the Physician Assistant National Certification Examination (PANCE) following graduation to obtain certification.
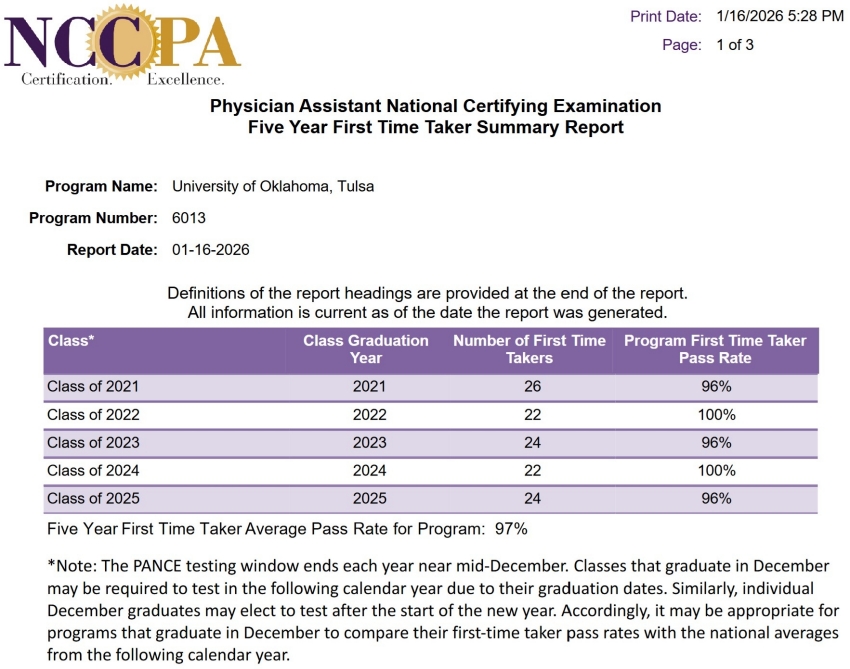
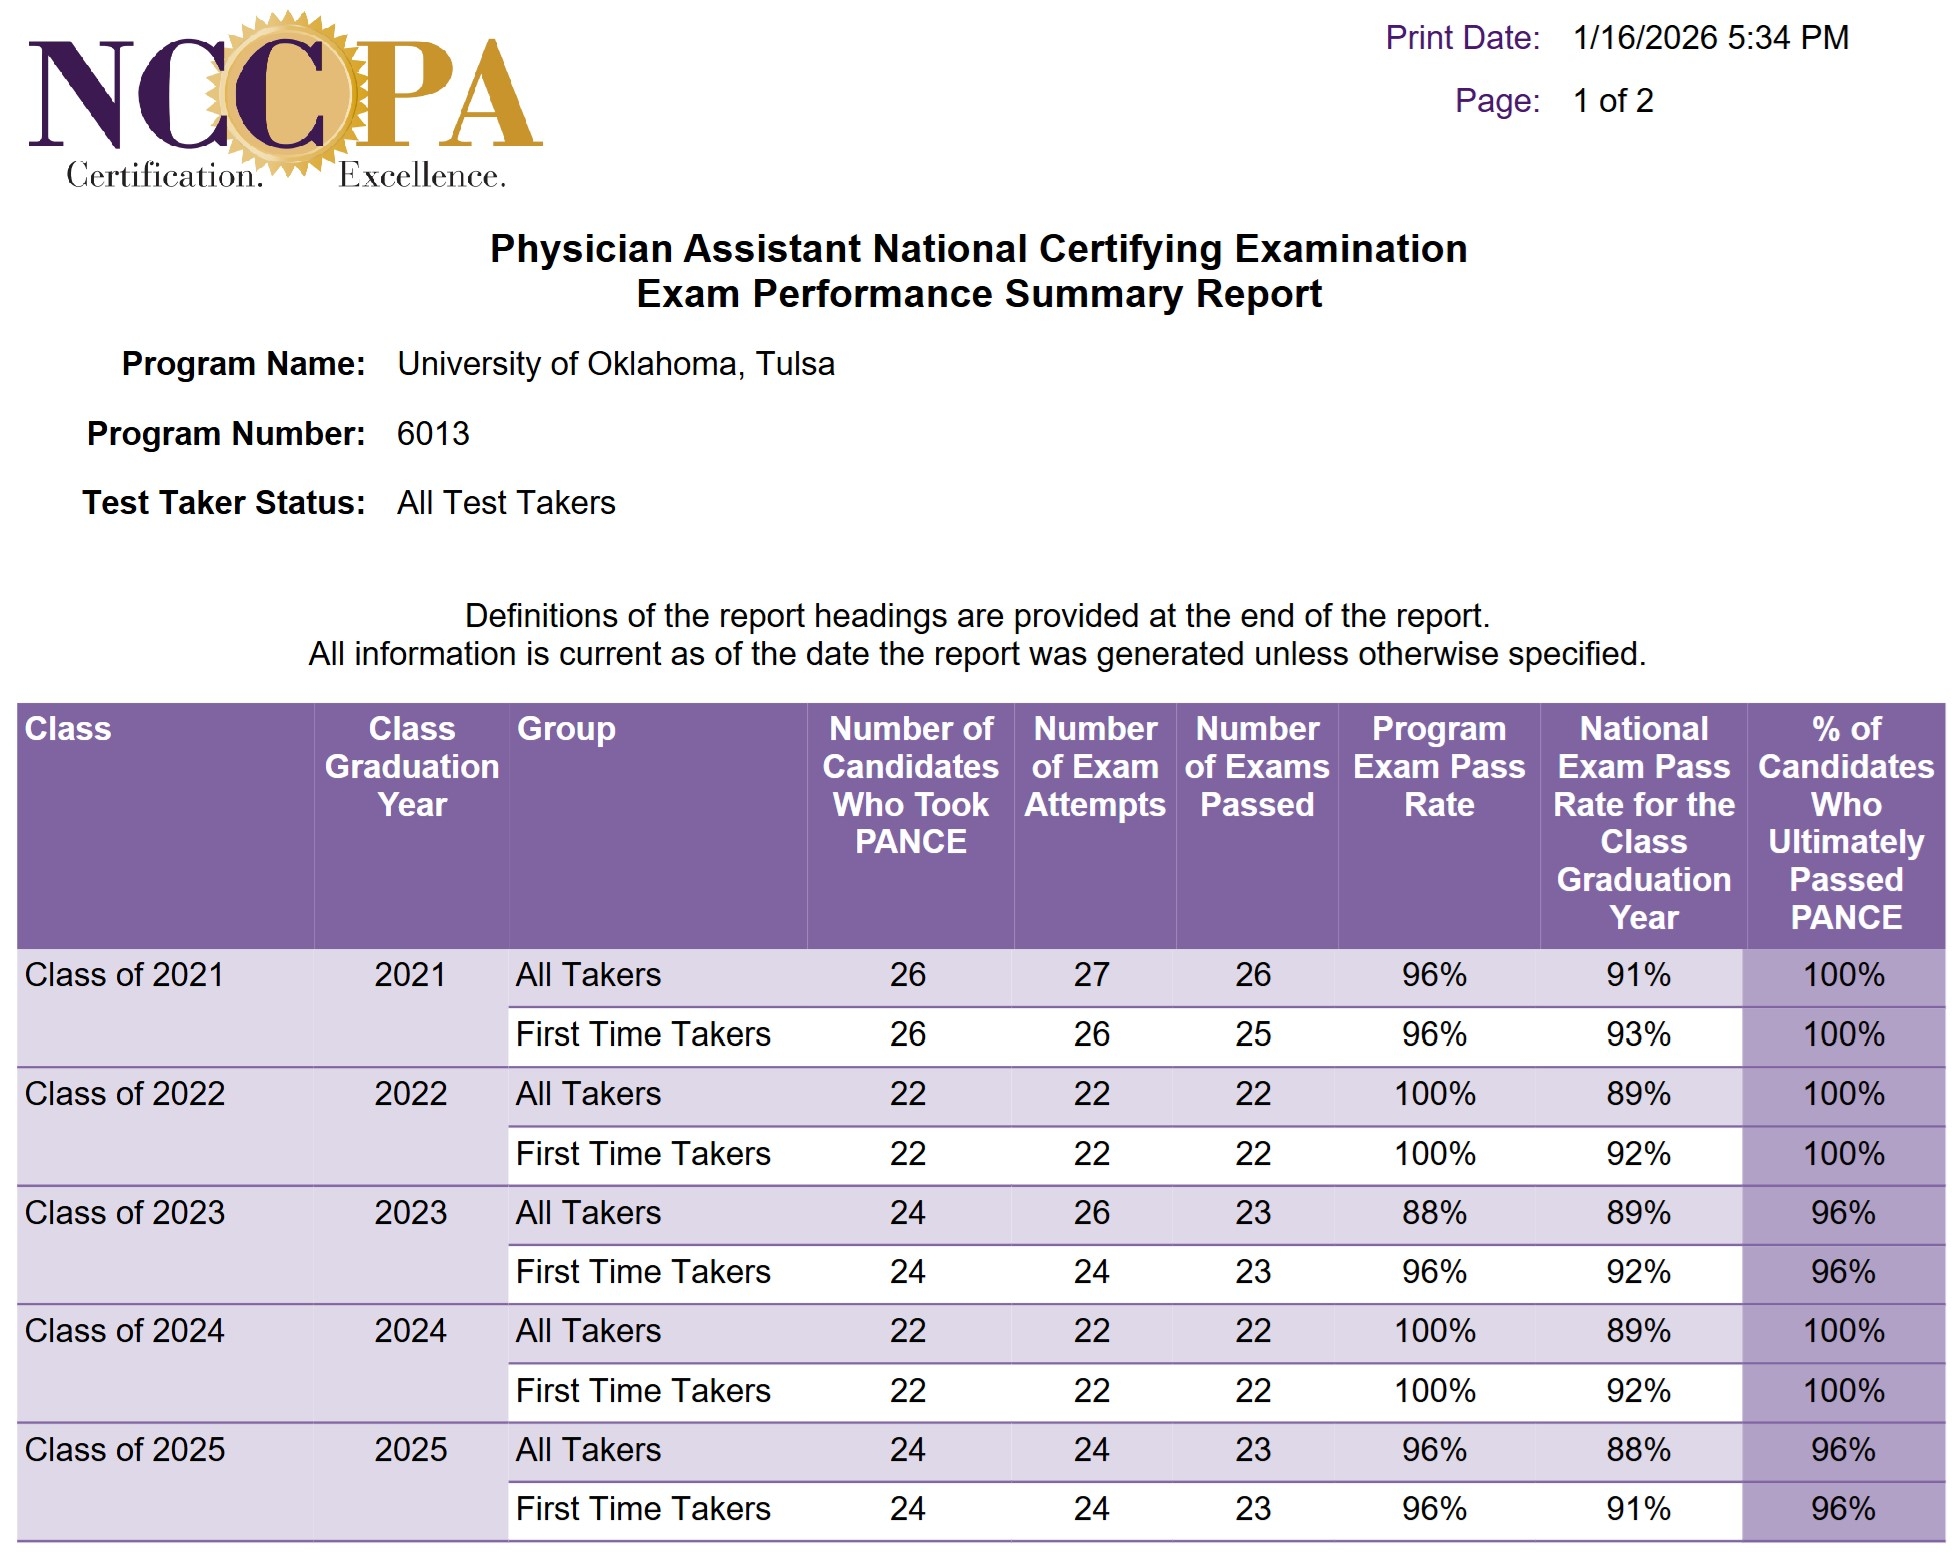
- Measure: Five-year first-time PANCE pass rate average that meets or exceeds the national average.
- Outcome: The OU SCM PA Program 5-year first-time PANCE pass rate is 97% compared to the national average of 92%.
| 2021 | 2022 | 2023 | 2024 | 2025 | 5-Year Average | |
|---|---|---|---|---|---|---|
| Cohort First-Time Test Takers | 26 | 22 | 24 | 22 | 24 | 118 |
| Cohort Passed First Time | 25 | 22 | 23 | 22 | 23 | 115 |
| Cohort First-Time Pass Rate | 96% | 100% | 96% | 100% | 96% | 97% |
| National First-Time Pass Rate | 93% | 92% | 92% | 92% | 91% | 92% |
- Measure: PAEA End of Curriculum (EOC) exam performance for the most recent graduating cohort at or above the national mean
- Outcome: The Class of 2025 EOC mean of 1541 exceeded the national mean of 1516.
| Class of 2023 | Class of 2024 | Class of 2025 | |
|---|---|---|---|
| EOC Cohort Mean | 1526 | 1519 | 1541 |
| EOC National Mean | 1519 | 1516 | 1516 |
| Meets or Exceeds | Yes | Yes | Yes |
- Measure: Graduate response at 90% or higher (three-year average) selecting Strongly Agree or Agree on the graduate survey measure “I received a high-quality education from the OU-Tulsa PA Program.”
- Outcome: 99% of the graduates from the 2023-2025 cohorts selected Strongly Agree or Agree on the graduate survey.
| Class of 2023 | Class of 2024 | Class of 2025 | 3-Year Average | |
|---|---|---|---|---|
| Graduating Students | 24 | 22 | 24 | 70 |
| Strongly Agree/Agree | 24 | 22 | 23 | 69 |
| Percentage | 100% | 100% | 96% | 99% |
2. Foster a supportive learning environment that contributes to successful completion of an academically rigorous PA training program.
Rational: The OU SCM PA Program recognizes the challenges of completing an academically rigorous curriculum. The program faculty are dedicated to supporting students in achieving the necessary acquisition of medical knowledge, clinical skills, and professional behaviors to successfully complete the program. Additionally, the program recognizes the importance of providing holistic support to address academic, professional, and personal challenges.
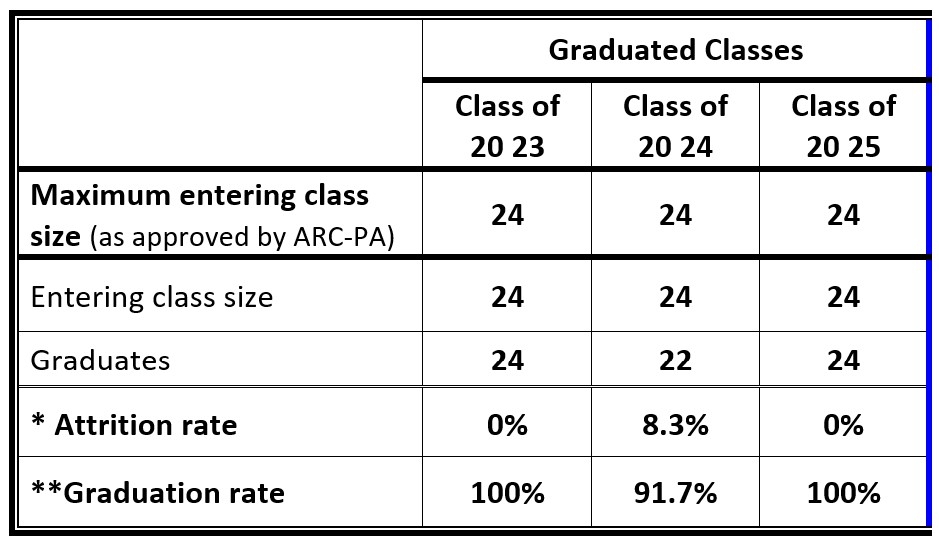
- Measure: Three-year graduation rate of 95% or higher (measure includes students who graduate with a different cohort)
- Outcome: Three-year graduation rate (2023-2025) of 97%
| Class of 2023 | Class of 2024 | Class of 2025 | 3-Year Average | |
|---|---|---|---|---|
| Matriculated Students* | 24 | 24 | 24 | 72 |
| Graduates | 24 | 22 | 24 | 70 |
| Graduation Rate | 100% | 92% | 100% | 97% |
- Measure: Graduate response at 90% or higher (three-year average) selecting Strongly Agree or Agree on the graduate survey measure “The faculty were available when I needed them for advising or support.”
- Outcome: 97% of the graduates from the 2023-2025 cohorts selected Strongly Agree or Agree on the graduate survey.
| Class of 2023 | Class of 2024 | Class of 2025 | 3-Year Average | |
|---|---|---|---|---|
| Graduating Students | 24 | 22 | 24 | 70 |
| Strongly Agree/Agree | 24 | 21 | 23 | 68 |
| Percentage | 100% | 95% | 96% | 97% |
- Measure: Student utilization of the Student Success Program at 75% or higher to discuss individualized needs for academic support (most recent cohort within the first 6 months of the program)
- Outcome: 88% of the Class of 2027 students met with the Student Success Program to discuss individualized academic support needs. Students had the opportunity to establish an ongoing therapeutic relationship with the counselor for further holistic support.
| Class of 2024 | Class of 2025 | Class of 2026 | Class of 2027 | |
|---|---|---|---|---|
| Matriculated Students | 24 | 24 | 24 | 24 |
| Met with SSP Counselor | 18 | 24 | 21 | 21 |
| Percentage | 75% | 100% | 88% | 88% |
3. Provide clinical experiences that promote a culture of serving diverse and underserved patient populations.
Rationale: The vision of the School of Community Medicine is to train a new generation of practitioners with the skills and desire to improve the health status of all Oklahomans. The OU SCM PA Program contributes to this vision by incorporating focused curriculum on population health, social determinants of health, and health disparities in order to prepare graduates to address the unique needs of our most vulnerable populations.
- Measure: 25% or more of graduates (three-year average) are employed working with underserved populations within a year of graduation (underserved includes tribal, rural, veteran, correctional facilities, disparities in ability to pay and ability to access care, disparities for reasons of race, religion, and language group)
- Outcome: 49% of graduates from the 2022-2024 cohorts are providing care to underserved populations
| Class of 2022 | Class of 2023 | Class of 2024 | 3-Year Average | |
|---|---|---|---|---|
| Graduates | 22 | 24 | 22 | 68 |
| Working in Underserved Setting | 10 | 13 | 10 | 33 |
| Percentage | 45% | 54% | 45% | 49% |
- Measure: Graduate response at 90% or higher (three-year average) selecting Strongly Agree or Agree on the graduate survey measure “I received adequate training in primary care underserved care.”
- Outcome: 99% of the graduates from the 2023-2025 cohorts selected Strongly Agree or Agree on the graduate survey.
| Class of 2023 | Class of 2024 | Class of 2025 | 3-Year Average | |
|---|---|---|---|---|
| Graduating Students | 24 | 22 | 24 | 70 |
| Strongly Agree/Agree | 23 | 22 | 24 | 69 |
| Percentage | 96% | 100% | 100% | 99% |
4. Encourage students to commit to providing medical care to communities within Oklahoma following graduation.
Rationale: Oklahoma consistently ranks among the nation’s states with the poorest health outcomes, including on measures for the delivery of high-quality, accessible, and equitable health care. Additionally, Oklahoma is facing a significant shortage in health care providers. The OU SCM PA Program is committed to addressing these challenges.
- Measure: 70% or greater of graduates (3-year average of most recent cohorts) accept clinical positions within the state of Oklahoma following graduation
- Outcome: 81% of the graduates from the 2022-2024 cohorts are employed as a PA in Oklahoma.
| Class of 2022 | Class of 2023 | Class of 2024 | 3-Year Average | |
|---|---|---|---|---|
| Graduates | 22 | 24 | 22 | 68 |
| Working in Oklahoma | 17 | 20 | 18 | 55 |
| Percentage | 77% | 83% | 82% | 81% |
Program Reports
| Summary of OU School of Community Medicine PA Graduates 2010-2024 | |
|---|---|
| PA Trainees: | |
| Total number of entering students | 388 |
| Total number of graduating students | 376 |
| Graduation percentage | 97% |
| PANCE Performance: | |
| Class of 2025 First-Time Taker Pass Rate | 96% |
| First-Time Taker Pass Rate (2010-2025) | 98% |
| Five-Year First-Time Taker Pass Rate | 97% |
| Employment: | |
| Graduates desiring employment as a PA employed | 100% |
| Practice Characteristics: | |
| Oklahoma | 80% |
| Tulsa | 51% |
| Primary Care | 40% |
| Underserved Community | 29% |
| Rural Community | 12% |
| Emergency Medicine | 14% |
| Surgery | 15% |
*Attrition rate calculation: Number of students who attritted from cohort (decelerated + withdrawls + dismissals) divided by the (entering class size + number joining class cohort).
**Graduation rate: Number of cohort graduates divided by the (entering class size + number joining class cohort).