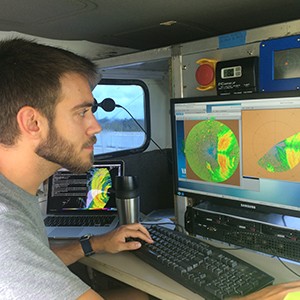
NORMAN—The University of Oklahoma Shared Mobile Atmospheric Research and Teaching radar team set up a mobile C-band radar on the shoulder of I-140 on the Cape Fear River bridge west of Wilmington, North Carolina, during Hurricane Florence landfall. Four OU and Purdue University portable integrated precipitation systems were placed in open fields southwest of Wilmington to measure raindrop sizes, winds, temperature, humidity and pressure. Sean Waugh, NOAA National Severe Storms Laboratory, launched weather balloons into the eye of the storm from Wrightsville Beach and the Wilmington International Airport.
“Since the hurricane moved slowly through our observing network, we measured winds and precipitation from the initial outer rain bands through the dissipation of the eyewall of the storm for more than 30 hours,” said Michael Biggerstaff, SMART-R team leader and professor in the School of Meteorology, OU College of Atmospheric and Geographic Sciences. “The data collected from Florence will greatly improve our understanding of the physical processes that affect extreme winds and heavy rains during landfall of hurricanes.”
OU’s Cooperative Institute for Mesoscale Meteorology Studies SMART-R team members included Biggerstaff; Gordon Carrie, OU research scientist; Addison Alford, OU doctoral student; and Noah Brauer, OU master’s student. For the first time, OU radar data was combined with the National Weather Service radar data to produce wind maps that were then shared in near real-time with the local NWS Forecast Office and Disaster Impacts Assessment Plan group that includes the Federal Emergency Management Agency and other agencies. The real-time delivery of the OU radar data was made possible by a collaboration between OU, AT&T and The Weather Channel.
Florence contained all the threats associated with hurricanes. Surge to the north of Wilmington flooded many homes and led to the rescue of hundreds of people in New Bern, North Carolina. Tornadic storms in the outer rainbands affected New Bern and areas northwest and west of Wilmington. Hurricane force winds in the eyewall downed large trees that damaged hundreds of homes and disabled power to hundreds of thousands of customers over a large portion of North Carolina and parts of South Carolina. The inner edge of the eyewall produced dozens of mesovortices that carried extreme wind gusts. Heavy rains from the eyewall, outer rain bands and vortex-Rossby-wave-driven inner core rain bands led to extensive flooding across North Carolina as rivers crested to record levels.
The OU radar team collected data on all these events for more than 30 hours through wind gusts of up to 100 miles per hour at the Cape Fear River bridge. Waugh shared observations from the NSSL weather balloons, which showed an evolution in the amount of low-level wind shear and instability from the outer bands into the eye of the hurricane. Compared to Irma, the instability was more modest, and there were fewer tornadic cells in the outer rain bands in Florence.
OU coordinated with John Schroeder, Texas Tech University, in the placement of 48 StickNet weather stations, and Forrest Masters, University of Florida in the deployment of two 15-meter and 10-meter wind measurement towers. The winds collected by Schroeder and Masters will validate the extrapolation of the OU-radar derived wind fields to near surface. The near-surface winds are needed for wind engineering assessments of damage to built structures so building codes can be evaluated and enhanced to better mitigate damage from future landfalling hurricanes.
For more information, contact Biggerstaff at 405.623.1769 or email drdoppler@ou.edu.


