The Ouachita Mountains dominate southeast Oklahoma, with peaks rising as much as 2,000 feet above their base. Extreme east-central Oklahoma features the mountains of the Arkansas River Valley, rising several hundred feet above the plains. Extreme northeastern counties are part of the Ozark Plateau, marked by steep, rocky river valleys between large areas of hills and rolling plains. The western tip of the panhandle is part of the fractured terrain of the Black Mesa complex.
Oklahoma lies entirely within the drainage basin of the Mississippi River. The two main rivers in the state are the Arkansas River, draining the northern two-thirds of the state, and the Red River, which drains the southern third and is the state's southern border. Principal tributaries of the Arkansas are the Verdigris, Grand (Neosho), Illinois, Cimarron, Canadian and North Canadian. The Washita and Kiamichi are the Red's principal tributaries in Oklahoma, and the Little River flows into the Red after it crosses into Arkansas.
According to the Koppen climate classification, Oklahoma's climate ranges from humid subtropical in the east to semi-arid in the west. Warm, moist air moving northward from the Gulf of Mexico often exerts much influence, particularly over the southern and eastern portions of the state, where humidity, cloudiness and precipitation are resultantly greater than in western and northern sections. Summers are long and usually quite hot. Winters are shorter and less severe than those of the more northern Plains states. Periods of extreme cold are infrequent, and those lasting more than a few days are rare.
Our knowledge of climate is based on the variables that we measure, typically with surface observing stations, weather radar, satellites, weather balloons, and other instrumentation. Some weather events cannot be measured easily by automated methods (e.g., tornadoes) and must be documented by human observers. Hence, as Oklahoma's population increased over the years, human observations of rare events became more prevalent. Even measurements of mundane variables such as temperature have become more common, with automated weather stations taking more measurements per day at more locations than in past decades. Climatologists know how to work with changes in observing intervals, sensors, techniques, and locations to provide decision makers with an historical record to better understand climate normals, extremes, and variability.
The following sections highlight some of these variables and associated events.
The mean annual temperature over the state ranges from 62°F along the Red River to about 58°F along the northern border. It then decreases westward to 56°F in Cimarron County.
Temperatures of 90°F or greater occur, on average, about 60–65 days per year in the western panhandle and the northeast corner of the state. The average is about 115 days in southwest Oklahoma and about 85 days in the southeast. Temperatures of 100°F or higher occur, frequently during some years, from May through September, and very rarely in April and October. With 30–40 days at or above 100°F, western Oklahoma experiences more extreme summer temperatures than elsewhere in the state. Both the panhandle and eastern Oklahoma average about 15 days above the century mark. The increased humidity in the east, however, adds to that section of the state's summertime misery.
Heat index values of 105°F or greater occur more than 40 times per year in the far southeast and less than 10 times per year in the far northwest. Years without 100°F temperatures are rare, ranging from about one of every seven years in the eastern half of the state to somewhat rarer in the west.

The highest temperature ever recorded in the state was 120°F. This reading was first observed during the brutally hot summer of 1936: at Alva on July 18, at Altus on both July 19 and August 12, and at Poteau on August 10. In addition, Tishomingo observed 120°F on July 26, 1943.
Temperatures of 32°F or less occur an average of 60 days per year in the southeast. This value increases to about 110 days per year where the panhandle joins the rest of the state, and to 140 days in the western panhandle. The lowest temperature on record is -31°F, set at Nowata on February 10, 2011.

The average length of the growing season, or freeze-free period, is at a maximum of 225 to 230 days in the southern tier of counties and in the Arkansas River Valley downstream of Tulsa. The value generally decreases to about 195 days in the eastern panhandle, then more rapidly to 175 days in the western panhandle. The general northwest-to-southeast gradient is interrupted in the Ouachita Mountains, where growing seasons are three to four weeks shorter compared to surrounding areas.
Along the Red River, the average date of the last freeze of spring ranges from about March 15 in the east to April 1 in the west. In northern Oklahoma, the last freeze of spring occurs, on average, from about April 8 near the Missouri border to April 15 in the eastern panhandle to the last week of April in the western panhandle. Freezing temperatures have occurred as late as April 20 along the southern border and in east-central Oklahoma to about May 15 in northwest Oklahoma to the last days of May in the western panhandle.
The average date of the autumn's first freeze varies from about October 15 in the western panhandle, to about October 25 along the northern border and in northwestern Oklahoma, to about November 10 along the Red River and in the Arkansas River Valley downstream of Tulsa. Autumn freezes have occurred as early as about September 15 in the western third of the state to about October 15 in the southeast corner. Again, the Ouachita Mountains tend to differ from surrounding terrain by about two weeks during either season.
Frozen soil is not a major problem, nor much of a deterrent to seasonal activities. Its occurrence is rather infrequent, of very limited depth, and of brief duration.
The dominant feature of the spatial distribution of rainfall across Oklahoma is a sharp decrease in rainfall from east to west. Although precipitation is quite variable on a year-to-year basis, average annual precipitation ranges from about 17 inches in the far western panhandle to about 56 inches in the far southeast. Only the summer months of July and August see a substantial relaxation of this distribution. The greatest annual precipitation recorded at an official reporting station was 84.47 inches at Kiamichi Tower in the southeast in 1957. The least annual rainfall occurred during 1956, when Regnier, in the extreme northwestern panhandle, observed 6.53 inches.

The frequency of days with measurable precipitation follows the same gradient as the annual accumulation, increasing from 45 days per year in western Oklahoma to 115 near the Arkansas border. On average, more precipitation falls during the nighttime hours, while greatest rainfall intensities occur during late afternoon. Excessive rainfall occurs at times. Amounts of 10 inches or more during 24 hours, while rare, have been recorded. The greatest official rainfall in a 24-hour period is 15.68 inches at Enid on October 11, 1973.
The character of precipitation also varies by season. Wintertime precipitation tends to be somewhat widespread, stratiform in nature, and tied almost exclusively to synoptic-scale systems. Rainfall is the dominant precipitation type during winter for all but the Oklahoma panhandle. Summertime precipitation is almost entirely convective in nature, produced by individual thunderstorms and thunderstorm complexes. The transition seasons of spring and autumn offer both convective and stratiform precipitation. A significant portion of the state's precipitation during the transition seasons is associated with systems of severe thunderstorms.
Average annual snowfall increases from less than two inches in the extreme southeast to nearly 30 inches in the western panhandle. The frequency of snow events also increases sharply along the same gradient. Locations in southeast Oklahoma have gone several years between events, while northwestern Oklahoma typically records several snow events in one winter.

Floods of major rivers and tributaries may happen during any season, but they occur with greatest frequency during those spring and autumn months associated with greatest rainfall. Such floods cost many lives and property damage during the first 50 years of statehood, but flood prevention programs have reduced the frequency and severity of such events. Flash flooding of creeks and minor streams remains a serious threat, especially in urban and suburban areas, where development and removal of vegetation have increased runoff.
Drought is a recurring part of Oklahoma's climate cycle, as it is in all the Plains states. Almost all of Oklahoma's usable surface water comes from precipitation that falls within the state's borders. Therefore, drought in Oklahoma is tied almost entirely to local rainfall patterns (that is, the influence of upstream events on drought is very small). Western Oklahoma is slightly more susceptible to drought because precipitation there tends to be more variable (percentage-wise) and marginal for dryland farm applications.
Drought episodes can last from a few months to several years. Those that last a few months can elevate wildfire danger and impact municipal water use. Seasonal droughts can occur at any time of the year, and those that coincide with crop production cycles can cause billions of dollars of damage to the farm economy. Multi-season and multi-year episodes can severely impact large reservoirs, streamflow and groundwater.
Since modern climatological recordkeeping began in the 1890s, the state has seen five major multi-year, regional drought events. These occurred in the late 1890s, from 1909–1918, 1930–1940, 1952–1958 and, to a lesser extent, 1962–1972. Each of these episodes contained at least one year of above-normal rainfall. The drought of the 1930s is associated with the Dust Bowl of the Great Plains, when socioeconomic conditions, agricultural practices and drought forced the largest emigration of Oklahomans in state history.
The agricultural impact of drought is increasingly mitigated on a farm-by-farm and year-by-year basis through irrigation of crops, mostly with groundwater. This practice dominates much of the panhandle and some of the rest of western Oklahoma.

On average, thunderstorms occur about 55 days per year in eastern Oklahoma, decreasing to about 45 days per year in the southwest. The annual rate increases to near 60 days annually in the extreme western panhandle. Late spring and early summer are the peak seasons for thunderstorms. December and January, on average, feature the fewest thunderstorms.
Frequent cold fronts, a favorable jet stream, and dry line development make springtime the preferred season for violent thunderstorms, although they can occur at any time of year. Severe weather threats during spring include squall lines, mesoscale convective systems, heatbursts, and rotating supercell thunderstorms that can produce very large hail, damaging winds, and tornadoes. Autumn marks a secondary severe weather season, but the relative frequency of supercell thunderstorms is much lower than during spring. Individual thunderstorms are common during the summer, but tend to be less severe and shorter lived. These storms can produce locally heavy rain and hail.
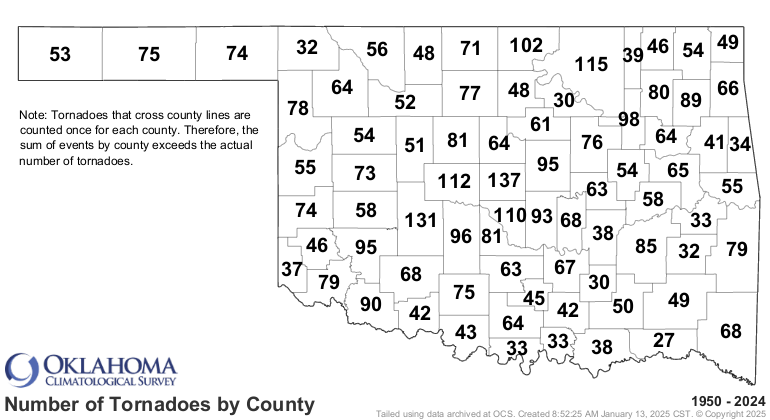
Tornadoes are a particular hazard in Oklahoma. Since 1950, an average of 53 tornadoes have been observed annually within the state's borders. Tornadoes can occur at any time of year, but are most frequent during springtime. Three-fourths of Oklahoma's tornadoes have occurred during April, May, and June. May's average of 20 tornado observations per month is the greatest. The winter months each average less than one tornado per month.
Severe weather can occur at any time of day, but the maximum frequency for severe weather is from mid-afternoon to sunset. About 80 percent of tornadoes are observed between noon and midnight Central Standard Time, with the peak hours being between 4:00 and 8:00 PM.
Annual average relative humidity ranges from about 60 percent in the panhandle to just over 70 percent in the east and southeast. On average, cloudiness increases from west to east across Oklahoma. The annual fraction of possible sunshine observed ranges from about 45 percent in eastern Oklahoma to near 65 percent in the panhandle. These fractions are highest in the summer and lowest in the winter for all portions of the state.
Average annual lake evaporation varies from 48 inches in the extreme east to 65 inches in the southwest, numbers that far exceed the average yearly rainfall in those areas. Evaporation and percolation into the soil expend about 80 percent of Oklahoma's precipitation.
Prevailing winds are from the south to southeast throughout most of the state from the spring through autumn months. These prevailing winds typically are from the south to southwest in far western Oklahoma, including the panhandle. The winter wind regime is about equally split between northerly and southerly winds.
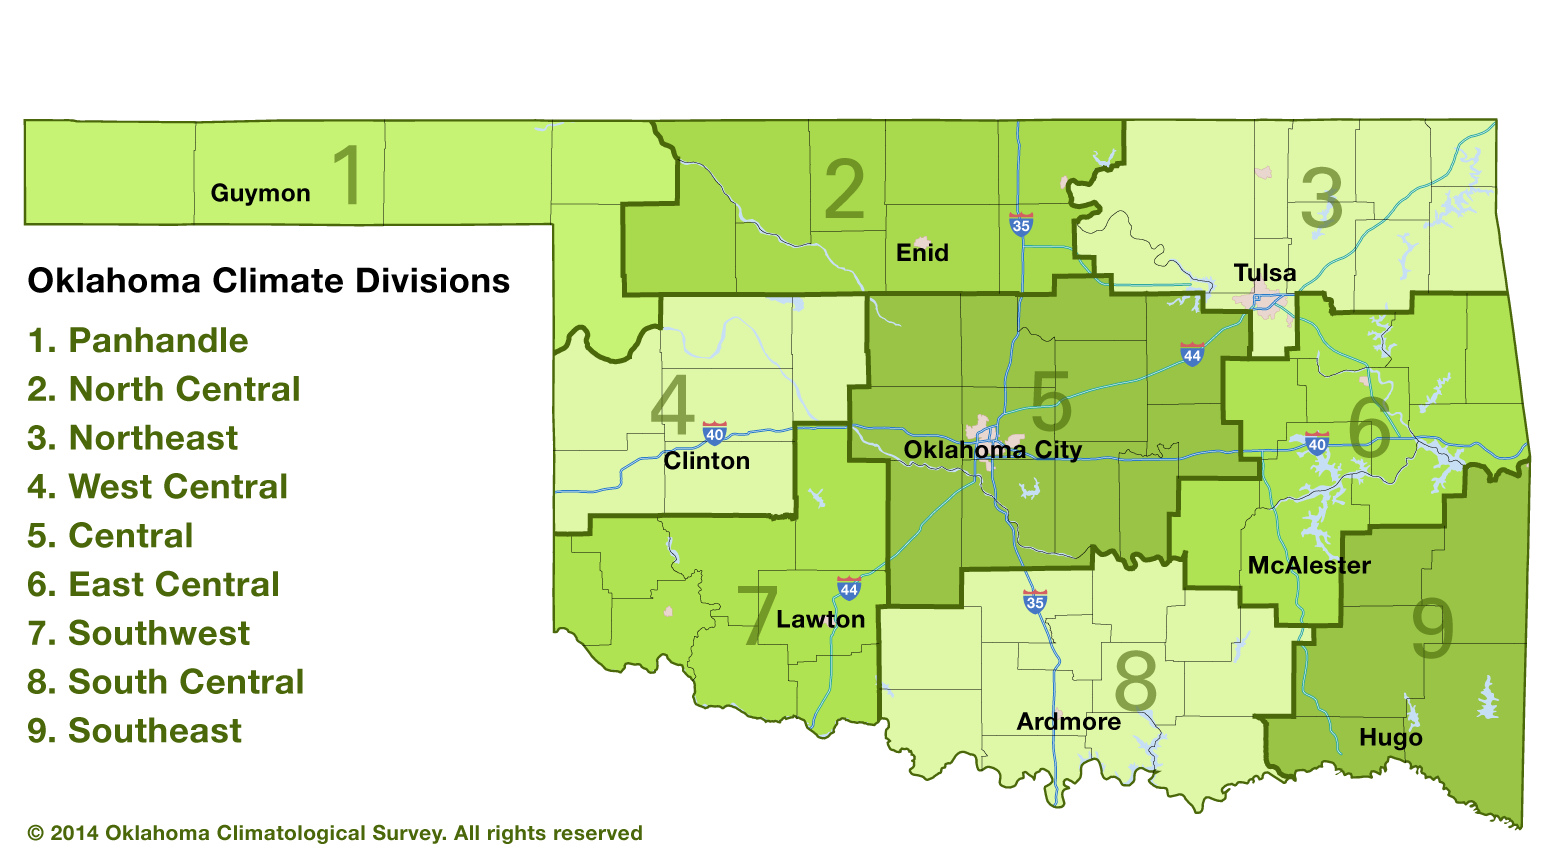
Oklahoma’s 77 counties are grouped into nine climate divisions: