
First of its Kind
GeoCarb is a collaboration between NASA, The University of Oklahoma and Lockheed Martin. This team is building an advanced payload on a satellite that will study the carbon cycle from geosynchronous orbit in an effort to advance science and provide societal benefit.
The mission will increase opportunities for Earth science, strengthen NASA’s partnerships, and provide a model that can be expand to other parts of the world.

A Geostationary View of the Americas
Launched into geostationary orbit at roughly 85 degrees west longitude, GeoCarb will be able to view the terrestrial biosphere over North and South America. It will be able to see major urban and industrial regions in the Americas, from Saskatoon in Canada to Punta Arenas in Chile, as well as large agricultural areas like the expansive South American tropical forests and wetlands.
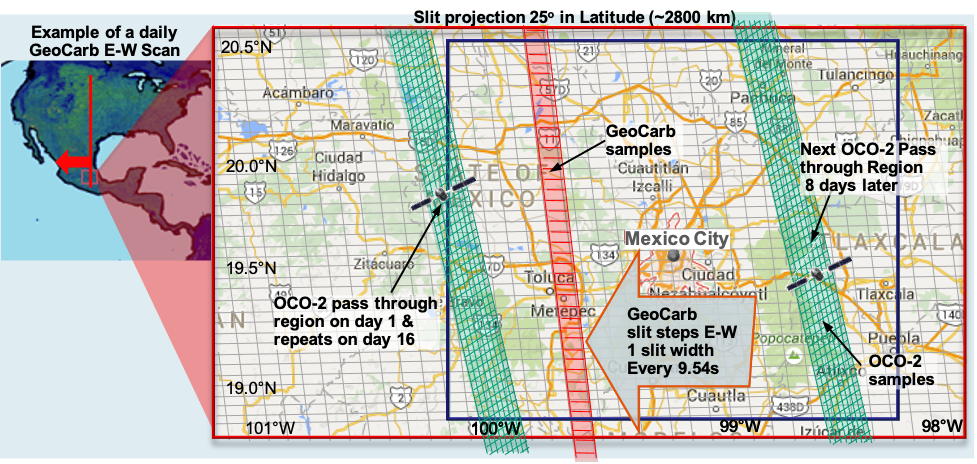
As a geostationary observatory, GeoCarb will complement the capabilities of existing key carbon-measuring instruments in low Earth orbit including OCO-2, OCO-3, GOSAT, GOSAT-2, and TROPOMI.
Why Geostationary Orbit?
Atmospheric concentrations of Carbon gases are a combination of fluxes at the surface and the motions of the atmosphere. Tracking terrestrial fluxes requires observations that are spatially and temporally dense. Low Earth Orbiting satellites can have long revisit times and large gaps in coverage. Weather also affects ecosystems on the time scale of days to weeks, meaning that polar orbiters may miss ecosystem transitions and hence fail to connect biogenic processes. Connecting to processes is essential for crucial Earth System Model improvements.
The Carbon Cycle
Carbon is a building block of life on Earth and understanding the carbon cycle is crucially important for many reasons. Carbon-based gases provide energy, assist in regulating temperature on Earth, are vital to the growth of plants, and support photosynthesis of marine phytoplankton and development of reefs. These and a variety of other processes connect all life on Earth.
Read more about GeoCarb's role in the Carbon-Climate Connection here.
GeoCarb's Goals
The scientific observatory will record daily measurements of the total concentration of carbon dioxide, methane and carbon monoxide in the atmosphere with a horizontal ground resolution of 3 to 6 miles (5 to 10 kilometers). The primary goal of the Geostationary Carbon Cycle Observatory is to probe, in unprecedented detail, the natural sources, sinks and exchange processes that control carbon dioxide, carbon monoxide and methane in the atmosphere. GeoCarb also will measure solar-induced fluorescence (SIF), a signal related to changes in vegetation photosynthesis and plant stress.
Persistant Observation
Geostationary Orbit will provide GeoCarb with an opportunity for persistent observation, using a stare-and-scan approach. This approach will allow the observatory to cover the land area within the GeoCarb field of view at least once per day. The instrument will stare for approximately 9 seconds and scan at a horizontal resolution of 3-6 miles, depending on viewing angle.
The unique slit spectrometer on the observatory will offer continental-scale, mapping-like coverage that allows for daily wall-to-wall coverage. Shorter revisit times and larger coverage area will deliver observations of the carbon cycle that are beyond the reach of observatories currently in orbit.
Carbon and Climate
In some years the biosphere takes more CO2 out of the atmosphere; in others it releases more to the atmosphere. We want to know more about what causes the year-to-year differences because that contains clues on how the carbon cycle works. For example, during the El Niño of 1997-1998, a sharp rise in CO2 was largely driven by fires in Indonesia. The most recent El Niño in 2015-2016 also led to a rise in CO2, but the cause was probably a complex mixture of effects across the tropics – including reduced photosynthesis in Amazonia, temperature-driven soil release of CO2 in Africa and fires in tropical Asia. These two examples of year-to-year variability in the carbon cycle, both globally and regionally, reflect what we now believe – namely, that variability is largely driven by terrestrial ecosystems. The ability to probe the climate-carbon interaction will require a much more quantitative understanding of the causes of this variability at the process level of various ecosystems.
GeoCarb's exploration of Earth's atmosphere is critical to better understanding the impact of burning in the western hemisphere, providing a unique insight by collecting carbon monoxide data alongside carbon dioxide and methane.
GeoCarb's world-class science team is providing the science community validated measurements and high order data products that may inform industry, science, and policy.
GeoCarb marks one of the most exceptional accomplishments in OU history, showcasing the university's outstanding national standing in research.
GeoCarb is the second space-based investigation in the Earth Venture Mission series of rapidly developed, cost-constrained projects for NASA's Earth Science Division.

Orbit | Geostationary, 65W-105W (depending on host spacecraft) |
Instrument | Single slit, 4-Channel IR Scanning Littrow Spectrometer (built by Lockheed Martin Advanced Technology Center) |
Spectral Bands | 0.76μm, 1.61μm, 2.06μm and 2.32μm |
Science Data | CO2, CO, CH4 & Solar Induced Fluorescence |
Spatial Resolution | 6km East-West x 3km North-South at the subsatellite point |
Temporal Sampling | ~1000 soundings North-South (along the slit) every 9s |
Daily Soundings | ~4,000,000 soundings per day |
Observational Coverage | North America and South America between 50S and 50N |
Mass | 156 kg (CBE) |
Dimensions | 1.3 m x 1.14 m x 1.3 m |
Power | 400W (CBE) |
Data Rate | 10 Mbps |
